
What do the Tazk Service Desk reports show?
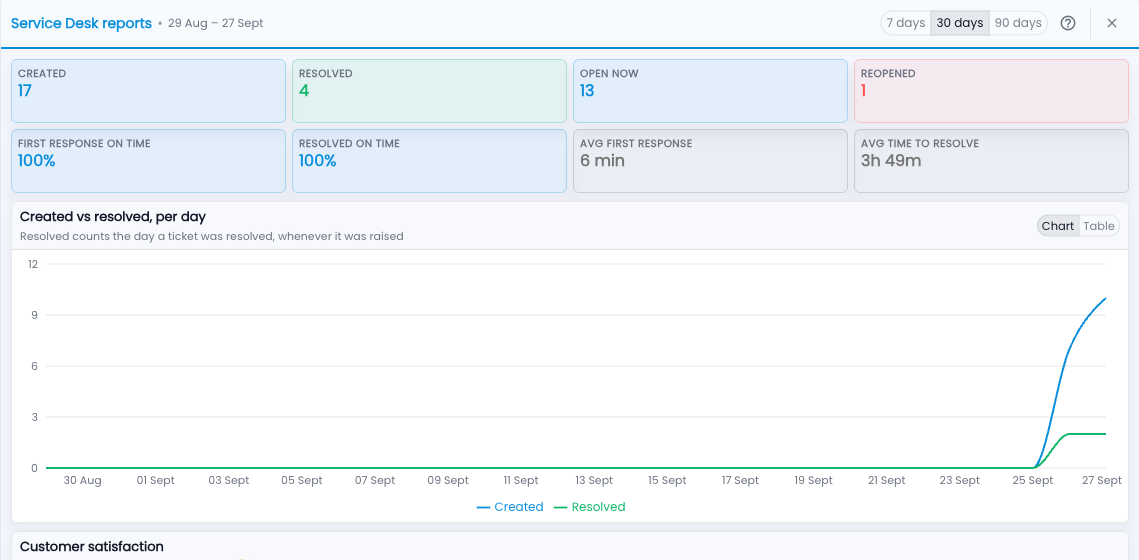
Volume, response and resolution times, customer satisfaction, knowledge use, rising issues and customers at risk. Service Desk › Reports answers the questions a support manager is asked: how many came in, how fast did we answer, did we keep our promises, and are customers happy?
Step by step
- Pick 7 days, 30 days or 90 days at the top.
- Read the tiles: created, resolved, open now, reopened, on-time rates and averages.
- Scroll for customer satisfaction, knowledge, rising issues, customers at risk, and the splits by request type, team and person.
- Click a ticket number or article to open it.
Words used here
| Term | What it means |
|---|---|
| On time | The share of tickets answered or solved within their promised time. |
| CSAT | The share of survey answers that were 😊 Great. |
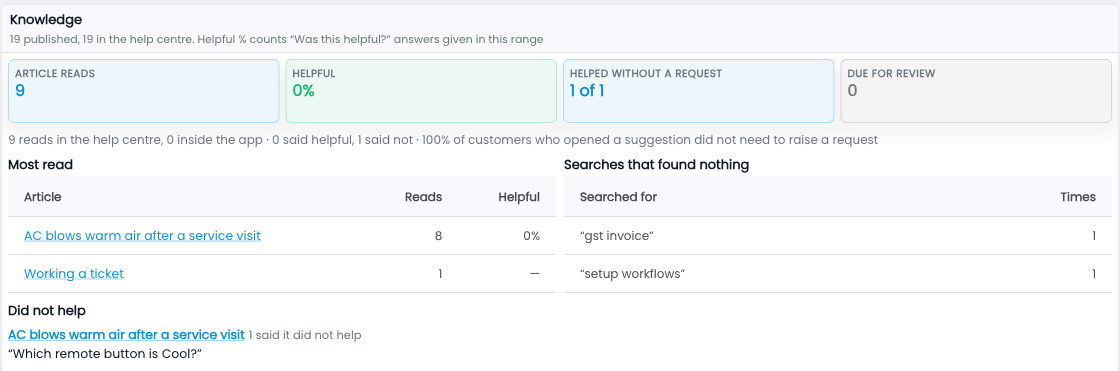
| Helped without a request | Customers who opened a suggested article while raising a request, and did not need to raise it. |
| Rising issue | At least 3 similar tickets this period and double the period before. |