
What does the Tazk CRM dashboard show?
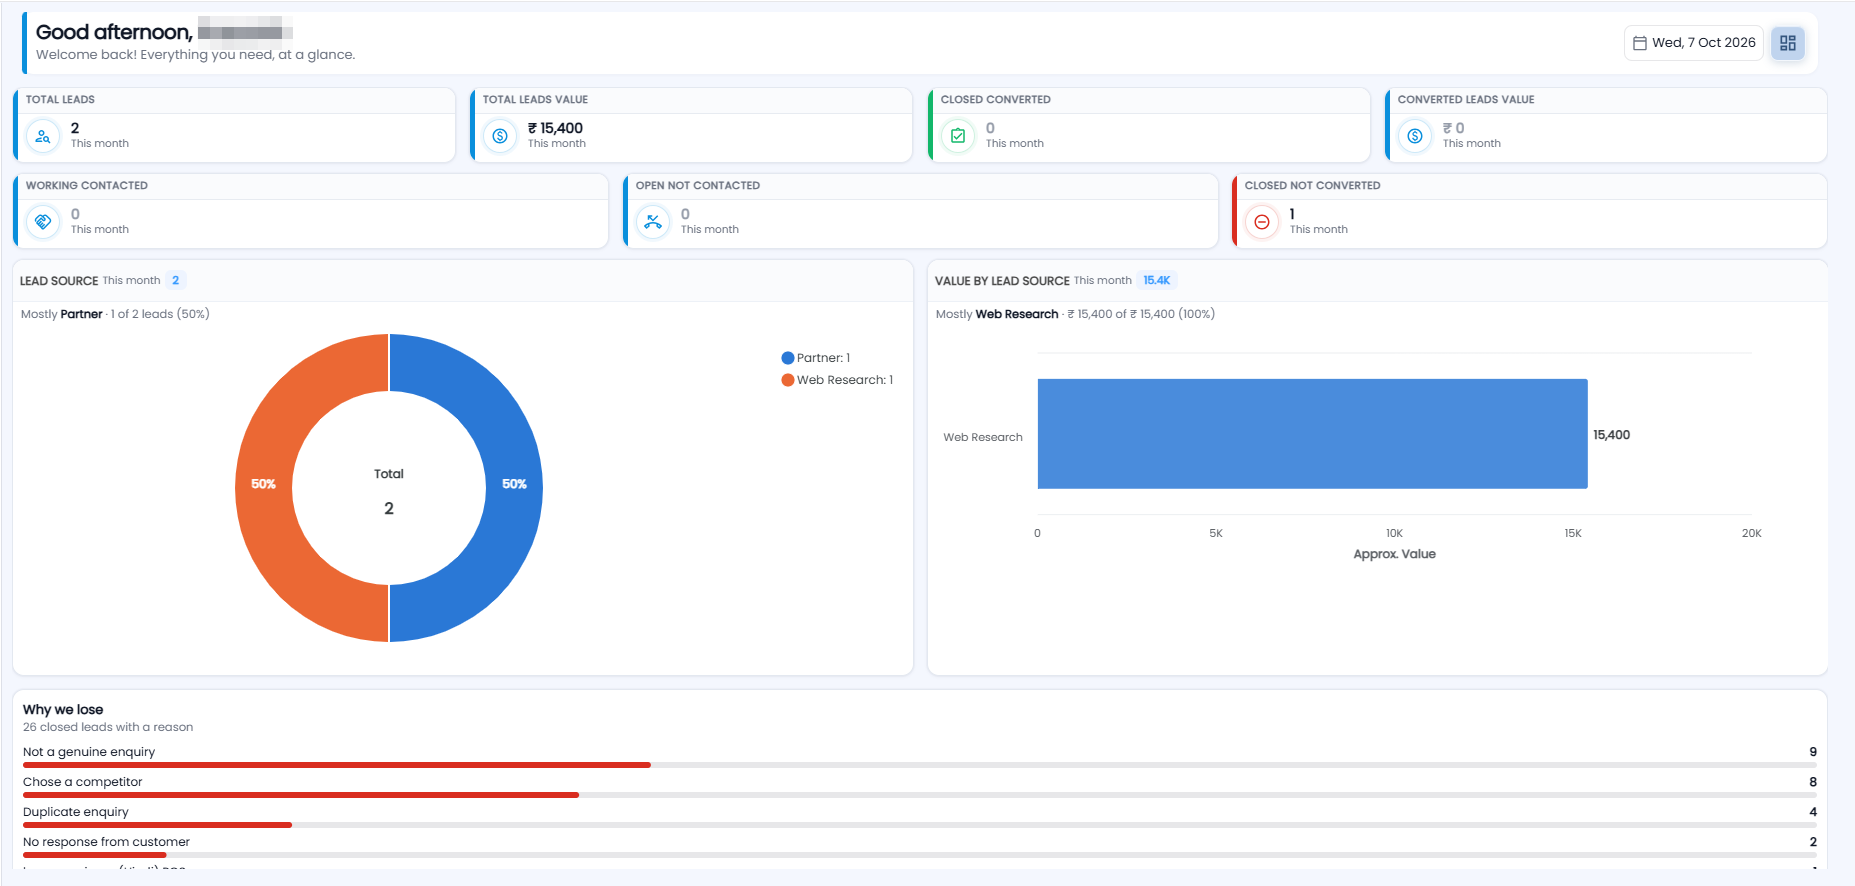
The dashboard is the first screen after you sign in. Under a greeting and today's date, seven tiles count this month's leads, their value, and how many are converted, being worked, not yet contacted or lost. Below them are charts of leads and value by source, why leads are lost, lead trends and the sales leaderboard, and at the bottom lists of today's leads, your open tasks, your meetings and the daily report. The figures refresh on their own every minute.
What is in the dashboard header?
A greeting — Good morning before 12:00, Good afternoon before 17:00, otherwise Good evening — with the first name on your login, and "Welcome back! Everything you need, at a glance." On the right are today's date and the Dashboards button, which switches between your dashboards and lets you choose which cards appear — see Create and Customise Dashboards.
The header stays at the top while you scroll. The date is only today's date: the CRM dashboard has no date range to pick.
What do the tiles at the top show?
Two rows of tiles count the leads created this month:
- Total Leads, Total Leads Value, Closed Converted and Converted Leads Value.
- Working Contacted, Open Not Contacted and Closed Not Converted.
Click a count tile to open the leads behind it. Each tile is explained in Dashboard Tiles and Charts Explained.
Which charts are on the dashboard?
| Card | What it shows |
|---|---|
| Lead Source | This month's leads by where they came from. |
| Value by Lead Source | This month's lead value by source. |
| Why we lose | The reasons given when leads were closed as lost. |
| Lead Comparison | Leads over the last four months. |
| Converted Leads | Converted leads over the last four months, by count or by value. |
| Closed Converted Leads | Converted value as a share of total lead value. |
| Sales Leaderboard | Lead value for each lead owner. |
| Pipeline by Leads Rep | The amount in the pipeline for each person. |
| Customer Growth | New customers over the last 6 months or the last year. |
Administrators see the charts in a slightly different order from managers and sales staff; the cards are the same.
What are the lists at the bottom?
- Today's Leads — leads that came in today.
- My Open Tasks — your tasks that are not completed.
- My Meetings — your meetings.
- Daily Report — for one day, how many leads are in each stage, from Open to Converted and Not Converted. Click the date button to see another day.
Each list can be exported as CSV or PDF.
How up to date are the figures?
The dashboard refreshes by itself every minute while it is open, and again when you come back to the browser tab. A lead you add or move shows in the figures within a short while — there is no refresh button to press.