
Project Dashboard
The Dashboard tab shows how the project is going.
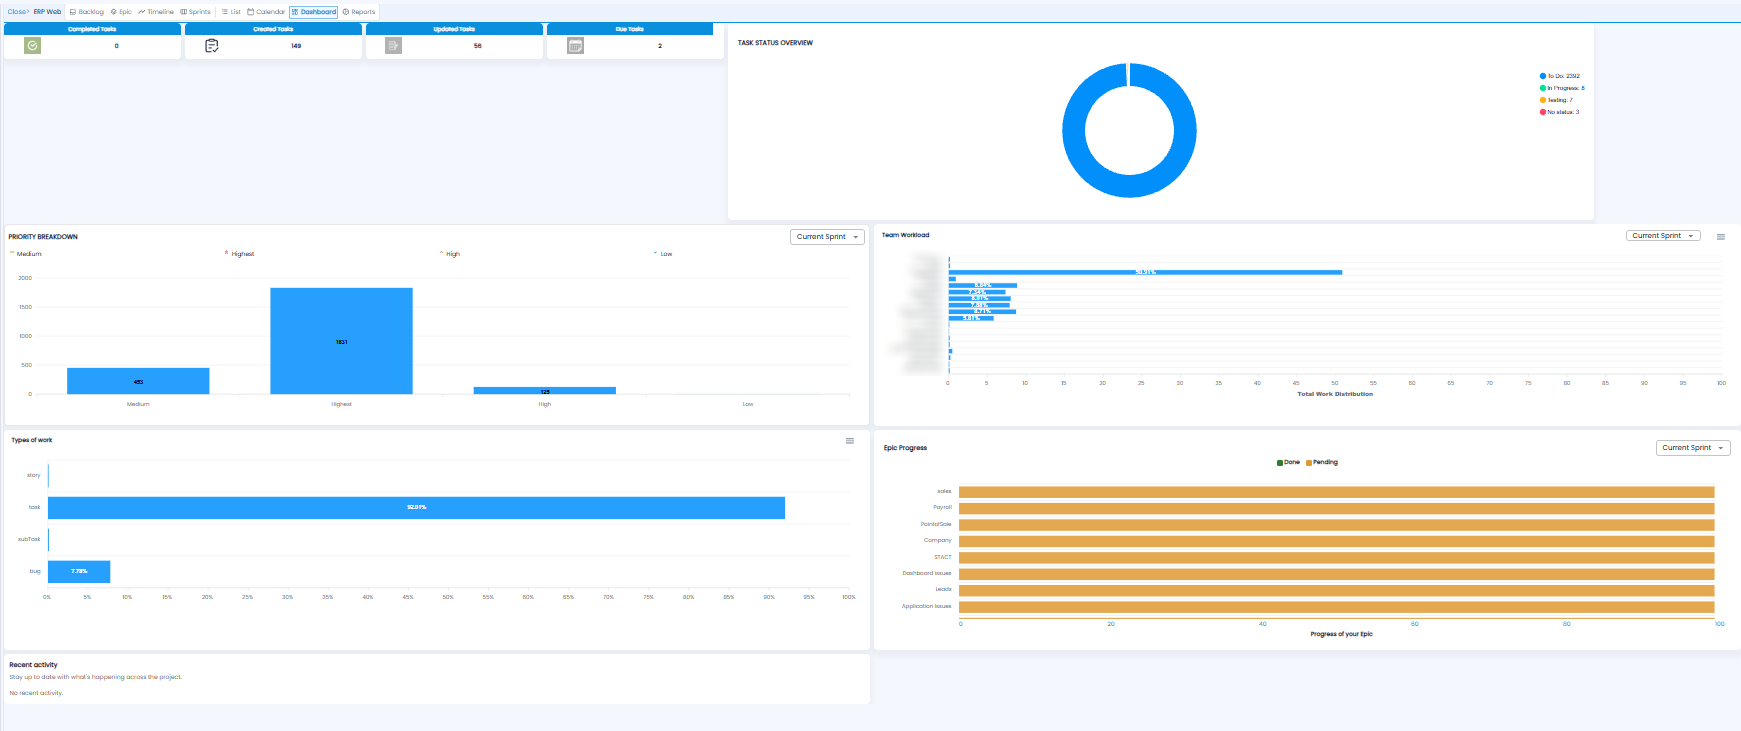
| Panel | What it shows |
|---|---|
| Completed / Created / Updated / Due Tasks | Task counts |
| Task Status Overview | Tasks by status — To Do, In Progress, Testing, and no status |
| Priority Breakdown | Tasks by priority |
| Team Workload | Each person's share of the work |
| Types of work | The share of stories, tasks, subtasks, and bugs |
| Epic Progress | Done and pending work in each epic |
| Recent activity | The latest changes in the project |
Several panels have a Current Sprint drop-down to change the period they cover.
Reports
The Reports tab has two reports: Work Log Report and Sprint Report.
Work Log Report
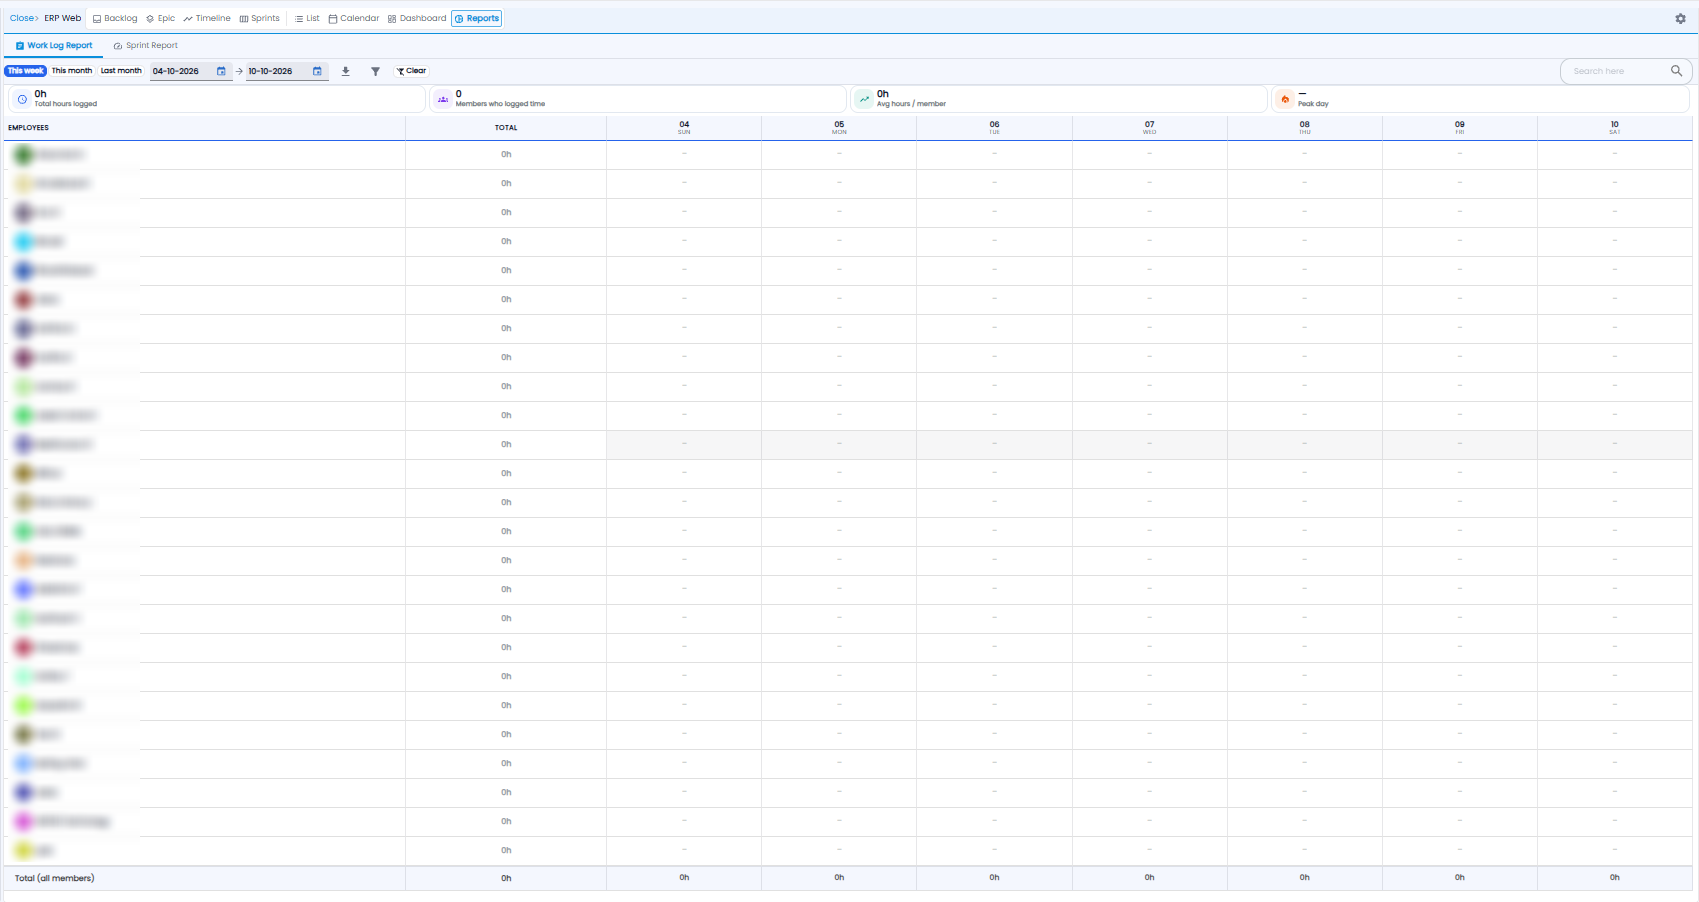
- Pick the period with This week, This month, or Last month, or set the dates
- The tiles show Total hours logged, Members who logged time, Avg hours / member, and the Peak day
- The table shows each employee's total and the hours they logged each day, with a Total (all members) row at the bottom
- Use the download icon to export, the filter icon to narrow, Clear to reset, and Search here to find a person
Sprint Report
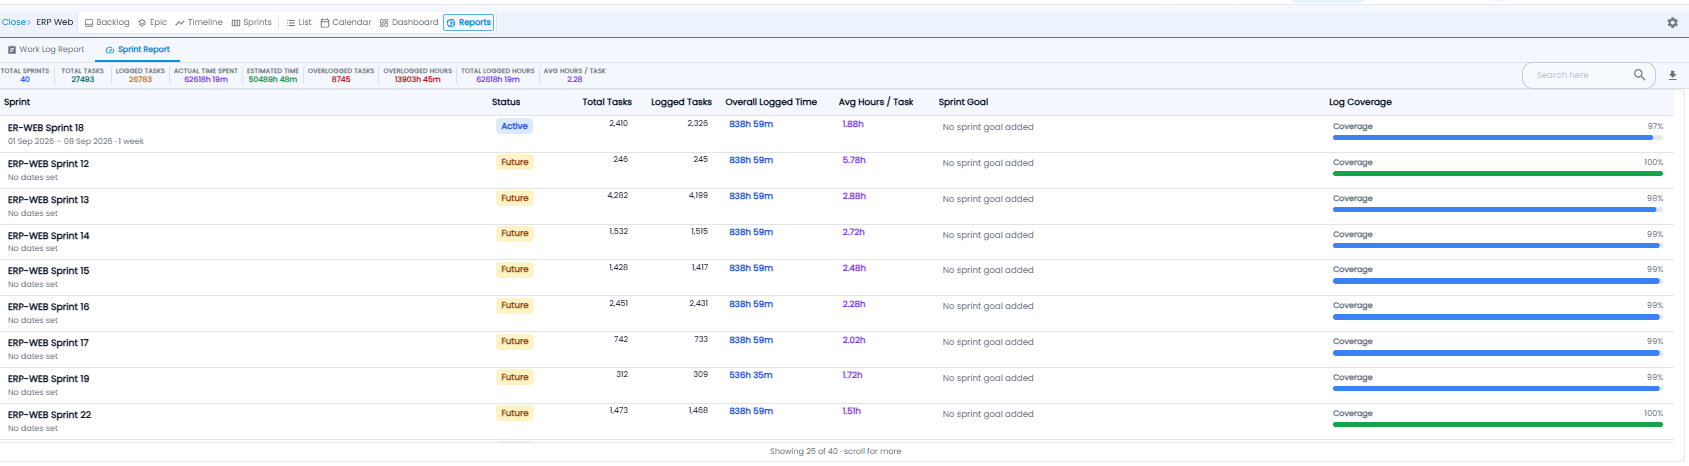
The figures at the top cover all sprints: Total Sprints, Total Tasks, Logged Tasks, Actual Time Spent, Estimated Time, Overlogged Tasks and Overlogged Hours (time logged beyond the estimate), Total Logged Hours, and Avg Hours / Task.
| Column | What it shows |
|---|---|
| Sprint / Status | The sprint with its dates, and whether it is Active or Future |
| Total Tasks / Logged Tasks | Tasks in the sprint, and how many have time logged |
| Overall Logged Time / Avg Hours / Task | Time logged in total and per task |
| Sprint Goal | The goal, if one was set |
| Log Coverage | The share of tasks with time logged, as a bar |
Note: Time only shows in these reports when Time Tracking is on for the project — see Project Settings.