
What does the Tazk POS dashboard show?
The dashboard is the home screen. It shows KPI cards for this month’s expenses, your biggest expense, cash in hand, total expense, inventory value, bank balance, unreconciled payments, sales, net profit, ROI, gross profit and e-commerce orders, plus receivable and payable ageing, a revenue and cost chart and stock by location. Every figure covers the locations your user is mapped to.
What do the KPI cards mean?
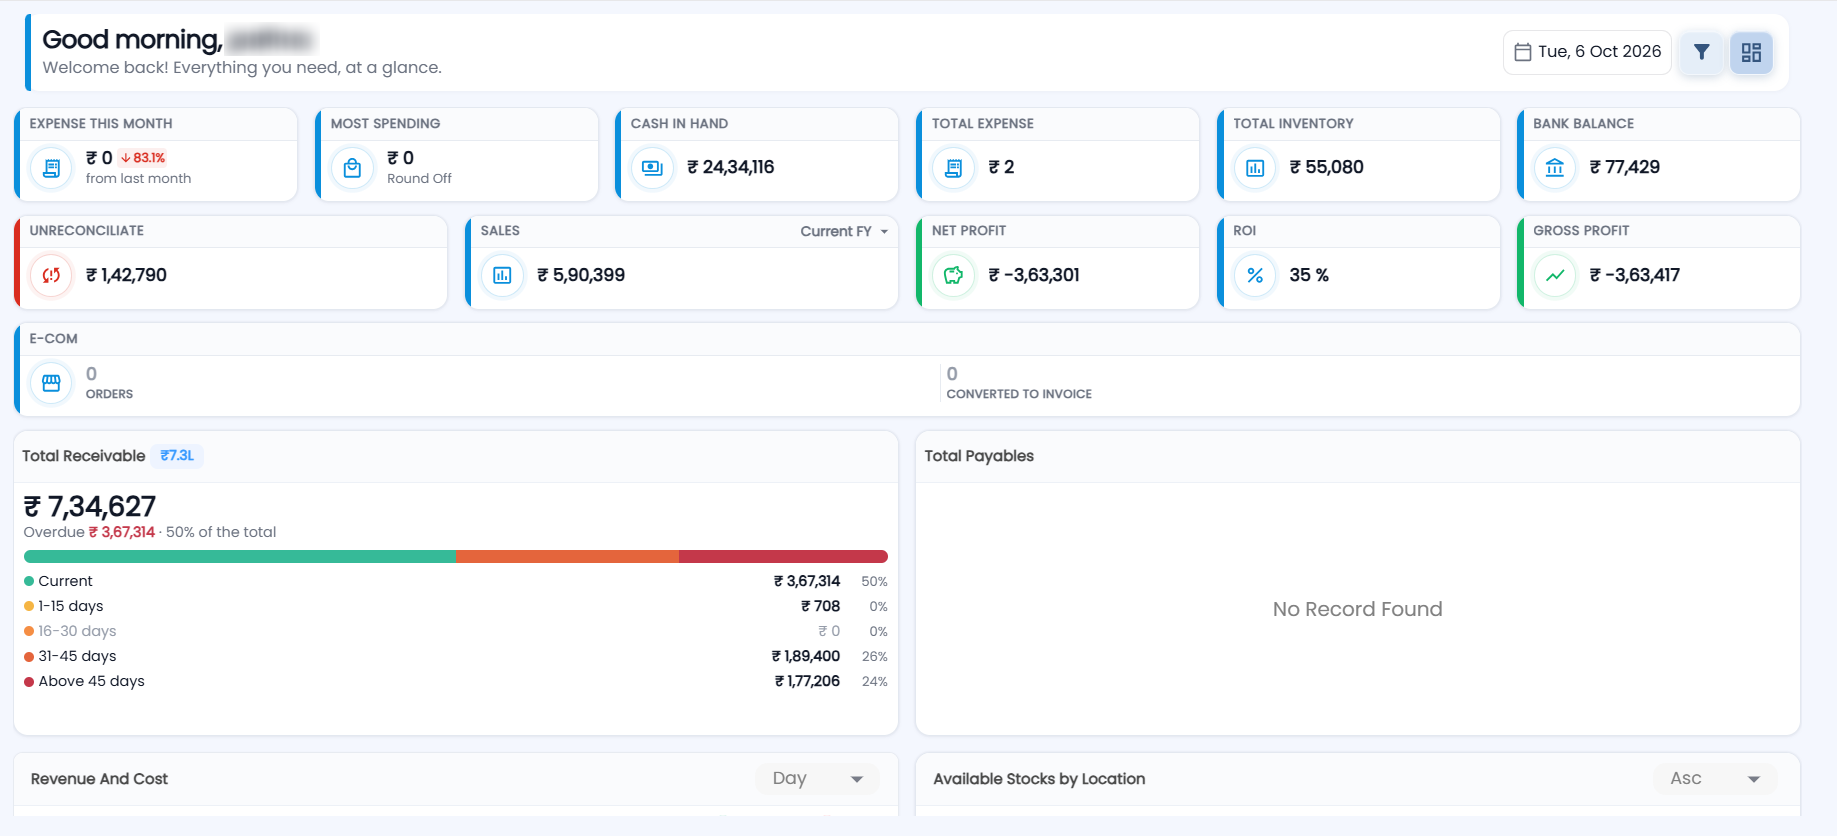
Click Dashboard in the sidebar. The top rows are small KPI tiles. Amounts are in ₹ with Indian digit grouping (for example 2,22,25,463).
| Card | What it shows |
|---|---|
| Expense This Month | Total posted to your Indirect Expenses ledgers this calendar month, with an arrow comparing it with last month |
| Most Spending | The single expense ledger you spent most on this month — its amount, with the ledger name underneath |
| Cash In Hand | The running balance of the cash boxes at your locations |
| Total Expense | Indirect expenses for the current accounting year |
| Total Inventory | The value of the stock available at your locations, at cost price excluding GST. Stock in a location named “Scrap Location” is left out |
| Bank Balance | The combined balance of the bank accounts linked to your locations. Credit-type (CC/OD) accounts are excluded, because they are a borrowing limit, not cash |
| Unreconciliate | Bank payments up to today that are not yet reconciled — the same figure Bank Reconciliation shows. Cash-box movements are not counted |
| Sales | Net taxable sales (after discounts, excluding GST and cancelled invoices). The dropdown on the card switches between Current FY, Current Month, Previous Month and Previous Year |
| Net Profit | For the current financial year (April–March): sales plus other income, minus cost of goods sold, minus indirect expenses |
| ROI | Net profit as a percentage of total cost (cost of goods sold plus indirect expenses), for the current financial year. Shows 0 % until something has been sold |
| Gross Profit | Sales revenue minus the cost price of the goods sold, for the current financial year |
| E-Com | Two numbers: Orders received from your online store, and how many were Converted to Invoice. Click the tile to open Ecom Orders. Shown only if your online store is active |
What do Total Receivable and Total Payables show?
Total Receivable is what customers owe you on unpaid invoices; Total Payables is what you owe vendors on unpaid bills. Each card shows:
- The total outstanding, in large figures, with a short-form chip in the header (for example ₹4.2L).
- The overdue amount and what share of the total it is, or Nothing overdue.
- A coloured bar split into age buckets — Current, 1-15 days, 16-30 days, 31-45 days and Above 45 days — from green to dark red, with each bucket’s amount and percentage listed below.
To act on the amounts, open Receivables or Payables.
What do the charts show?
| Chart | What it shows |
|---|---|
| Revenue And Cost | Two lines — Revenue (green) and Cost (red). The dropdown switches the period between Day, Week, Month and Year. Hover a point for the exact ₹ figures |
| Available Stocks by Location | A bar per location showing the value of the stock held there. The Asc / Desc dropdown sorts the bars |
Charts lower down the page load as you scroll to them, so the top of the dashboard appears quickly.
How do I filter the dashboard by date?
- Point to (or click) the filter button in the dashboard header — its tooltip reads Filter by date range.
- Choose a range: Today, Yesterday, This Week, Last Week, Last 7 Days, This Month, Last Month, This Quarter, Last Quarter, Current Fiscal Year, Previous Fiscal Year or Last 365 days.
- Or click Custom Range… and pick a From and To date.
- To go back to the normal view, open the list again and click Clear filter.
The filter recalculates the cards that are truly about a period — such as Most Spending, the expense breakdown and the top-sales charts. Point-in-time figures (cash in hand, bank balance, stock, receivables, payables) and cards that already compare fixed periods (such as Sales with its own dropdown) keep their normal values. Filtering only changes your view; it does not change any data.
How do I customise the dashboard?
You can keep up to five dashboards, each with its own name and layout. They all offer the same cards; each one just arranges and hides them differently.
- Point to the Dashboards button in the header to see your dashboards. Click one to switch to it, or click + New and enter a Dashboard name to add one.
- Click the pencil (Edit this dashboard) on a dashboard to enter edit mode.
- Drag cards to move them and drag their edges to resize them. Click the eye icon on a card to hide or show it, or use the Cards list to tick cards on and off (Show all / Hide all at the top). The list groups cards under headings such as Sales, Collections & Receivables, Cash & Bank, Inventory, Expenses and Profitability.
- Click Save Changes to keep the layout, or Cancel to discard it.
In edit mode you can also rename or delete the dashboard you are editing — except your first (default) dashboard, which cannot be renamed or deleted. Administrators also see Reset, which, after you confirm, puts the layout back to the default.
How up to date are the figures?
The card figures are calculated in the background and the open dashboard refreshes them about every minute while the browser tab is visible. If you have just saved an invoice or expense and a card has not moved yet, wait a moment. Every figure covers only the locations your user role is mapped to — two users of the same company can see different numbers.