
Dashboard at a Glance
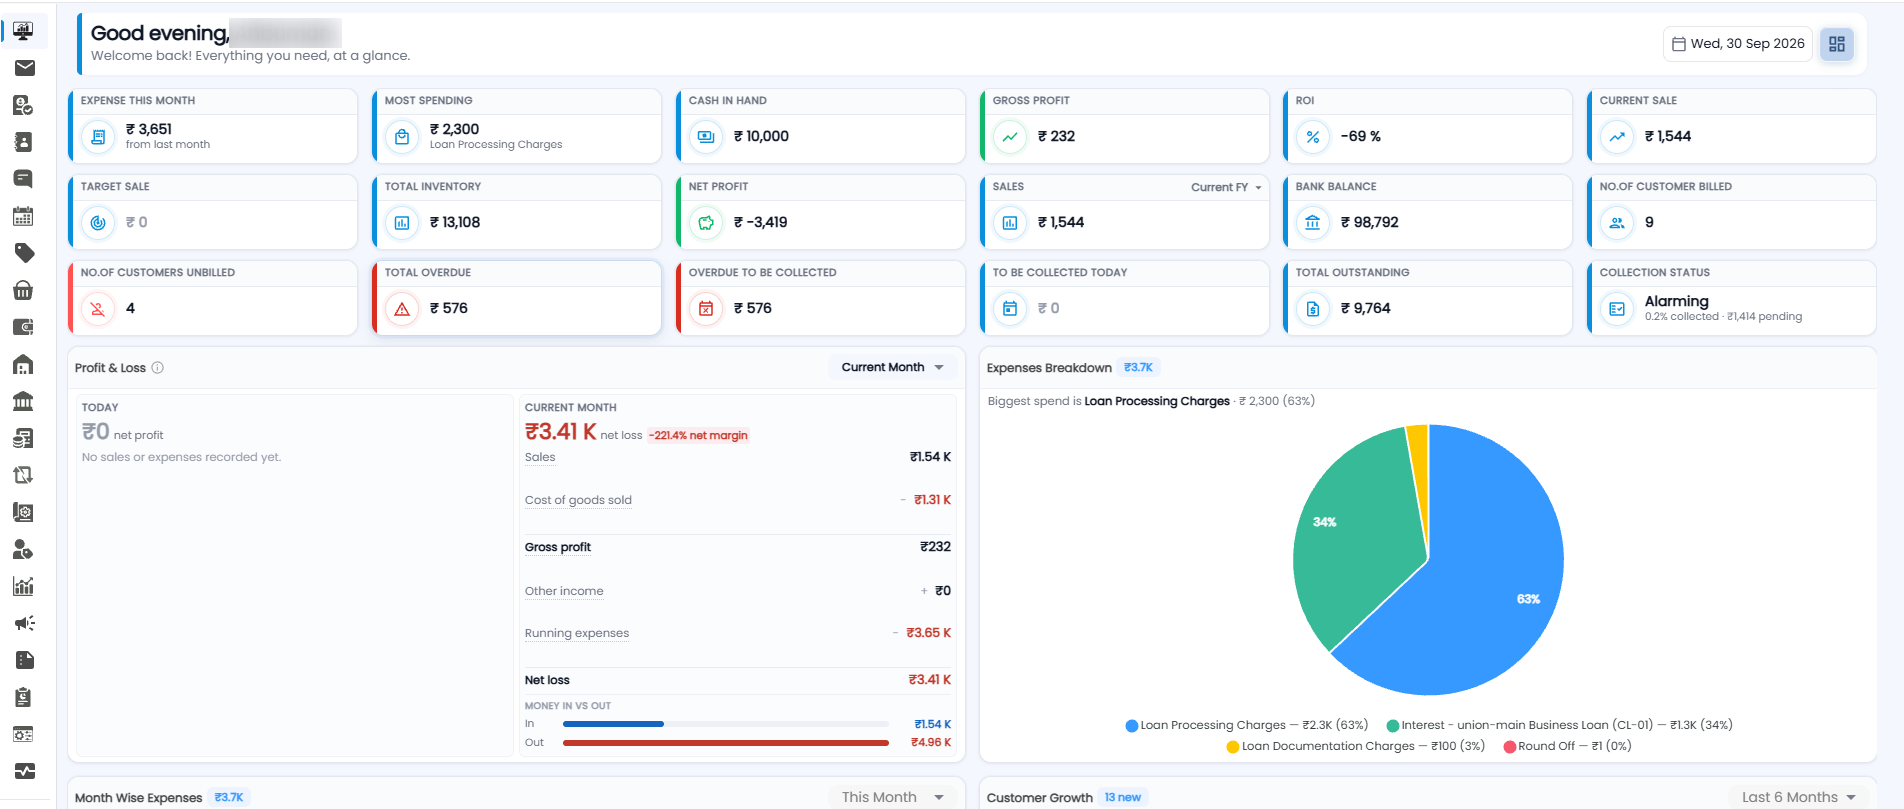
After signing in, the Dashboard is the first page you land on. It greets you by name (for example "Good evening, Anbumani") and brings together your sales, profit, cash, and collections so you can see how the business is doing at a glance.
The Top Bar
- Trial banner — shows how many days are left in your free trial, with a Subscribe Now button.
- Location — choose All-Location to see every location together, or pick one location.
- Apps icon — switch to your other Tazk applications.
- Notifications bell — the red badge shows how many notifications are waiting.
- Profile — your name and role. Click it to open your account menu.
Below the greeting, the date shows today, and the icon beside it changes the dashboard layout.
KPI Cards
The cards at the top give you the key numbers. Each card has a coloured edge so related figures are easy to spot.
Sales and Profit
| Card | What it shows |
|---|---|
| Current Sale | Your sales so far |
| Target Sale | The sales target set for you |
| Sales | Total sales for the period chosen in its dropdown, for example Current FY |
| Gross Profit | Sales minus the cost of the goods sold |
| Net Profit | What is left after all expenses (a minus figure is a loss) |
| ROI | Return on investment, as a percentage |
Money and Stock
| Card | What it shows |
|---|---|
| Expense This Month | What you have spent this month, compared with last month |
| Most Spending | Your biggest expense and what it was, for example Loan Processing Charges |
| Cash in Hand | The cash you are holding |
| Bank Balance | The balance across your bank accounts |
| Total Inventory | The value of your stock |
Customers and Collections
| Card | What it shows |
|---|---|
| No. of Customer Billed | How many customers have been billed |
| No. of Customers Unbilled | How many customers have not been billed |
| Total Overdue | The total amount that is past its due date |
| Overdue to be Collected | The overdue amount still to be collected |
| To be Collected Today | What is due to be collected today |
| Total Outstanding | Everything customers still owe you |
| Collection Status | How well collections are going, for example Alarming, with the percentage collected and the amount still pending |
Profit & Loss
The Profit & Loss panel shows whether you are making money. Use the dropdown at its top right (for example Current Month) to change the period.
- Today — today's net profit. If nothing has been recorded yet, it says No sales or expenses recorded yet.
- Current Month — the month's net profit or net loss, with the net margin. Below it, the working: Sales, minus Cost of goods sold, gives Gross profit; add Other income and take away Running expenses to reach the Net profit or Net loss.
- Money in vs out — two bars comparing the money that came in with the money that went out.
Expenses Breakdown
The pie chart on the right splits your expenses by type. The heading shows the total, and the line under it names your biggest spend and its share, for example Loan Processing Charges — ₹2,300 (63%). The legend below lists every expense with its amount and percentage.
More Charts
Scroll down for more charts, such as Month Wise Expenses and Customer Growth. Each has a dropdown to change the period, for example This Month or Last 6 Months.