
What does the Schemes Dashboard show in Tazk POS?
Schemes → DashBoard shows one pie chart for every open scheme that runs in the month you pick: how much of the target has been achieved and how much is left, with the brand and the scheme dates in the legend. Click a chart to see the item-wise, customer-wise quantities behind that scheme, and export them as PDF or CSV.
How do I open the Schemes Dashboard?
In the sidebar, open Schemes → DashBoard. The page header reads Scheme Dashboard. Only open schemes appear here — a scheme you delete from New Schemes is closed and drops off the dashboard.
How do I pick the month?
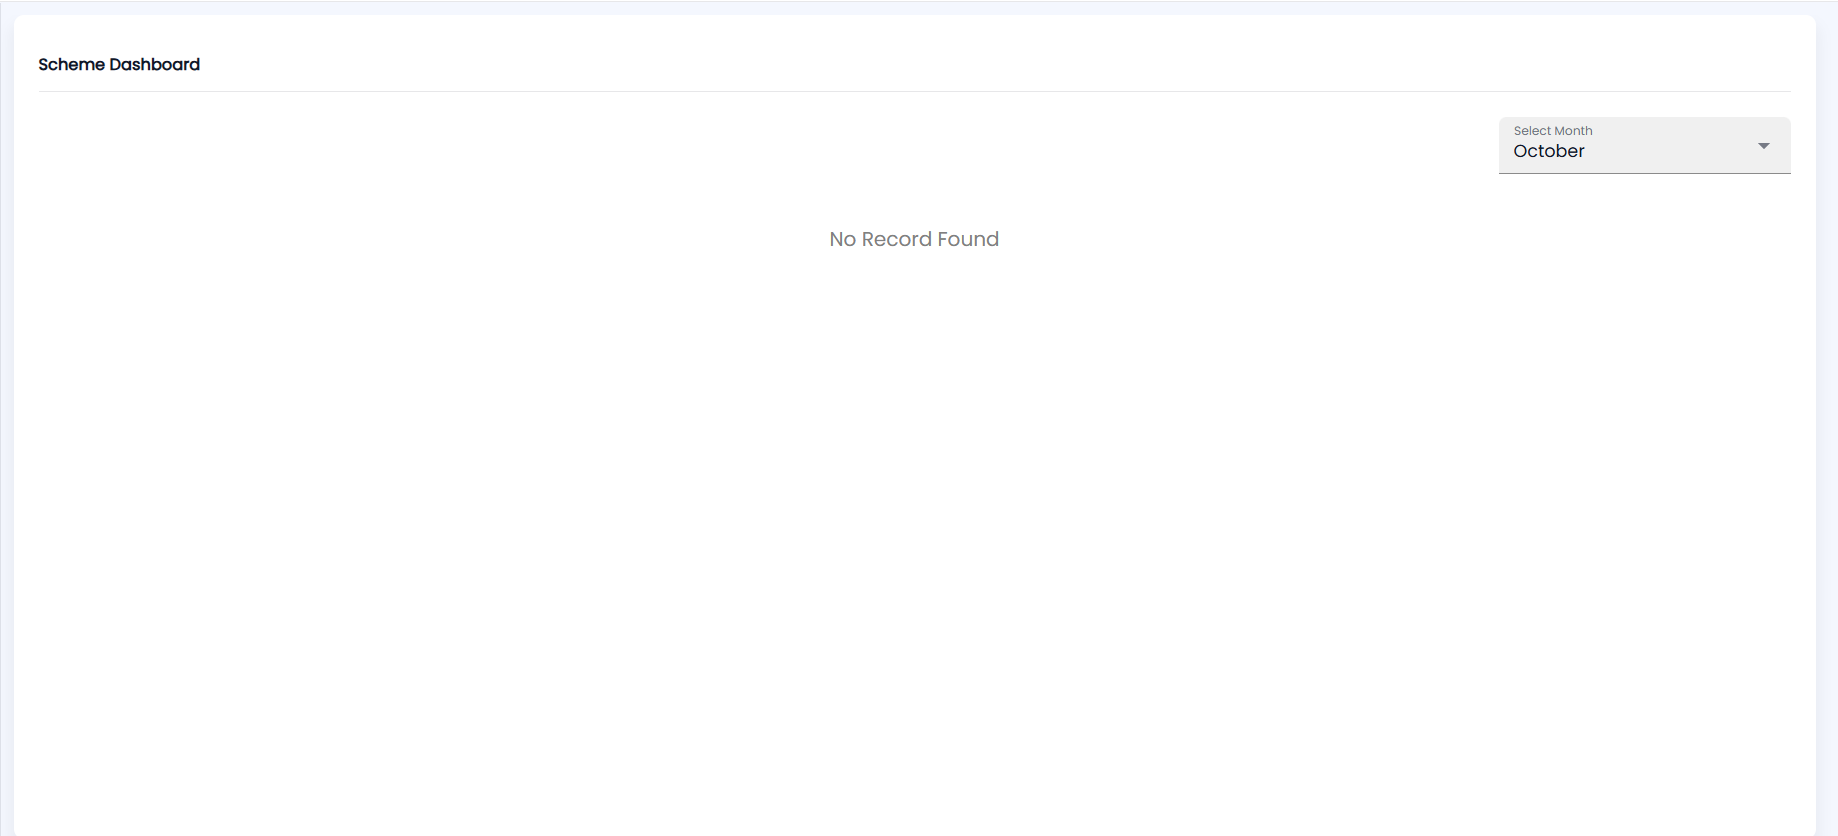
Use Select Month at the top right. It starts on the current month. The dashboard shows every open scheme that is active in that month of the current year — one that starts in the month, ends in it, or runs across it. If no scheme matches, the page says No Record Found.
What does each scheme chart show?
Each card is a pie chart titled with the scheme name. The two slices are the part of the target still to go and the part already achieved. The legend spells out the figures:
| Legend item | What it shows |
|---|---|
| Target | The scheme target |
| Achieved | Quantity of the scheme's products sold so far (0 when nothing has sold) |
| Brand | The brand the scheme is for |
| From / To | The scheme start and end dates |
Achieved is worked out from your sales of the products you attached to the scheme, so it moves as you bill those products on Invoices.
How do I see the sales behind a scheme?
- Click a scheme's chart. A table titled with the scheme name replaces the charts.
- Read the rows — one per item and customer.
- Use the export menu for Export PDF or Export CSV.
- Close the table to go back to the charts.
| Column | What it shows |
|---|---|
| Scheme&ItemName | The scheme the row belongs to |
| Item / Brand | The product sold and its brand |
| CustomerName / Location | Who bought it and from which branch |
| Target / Award | The scheme target and award |
| Quantity | Quantity sold |