
Overview
The Depreciation menu in the sidebar helps you work out how much value your assets lose each financial year. Click the arrow next to Depreciation to open its four sub-menus:
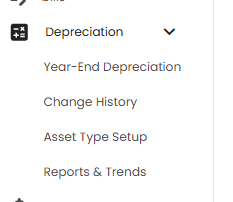
| Sub-menu | What it is for |
|---|---|
| Year-End Depreciation | Apply depreciation for a financial year and lock it (this article) |
| Change History | Every change made to a year's depreciation, and who made it |
| Asset Type Setup | Link each asset category to a depreciation group and rate |
| Reports & Trends | Depreciation trends, year-over-year comparison, and accounting entries |
Three Things to Know
The first time you open Year-End Depreciation, a short guide explains how the page works. Click Next and Back to move through it, and tick Don't show this again if you do not want to see it next time.
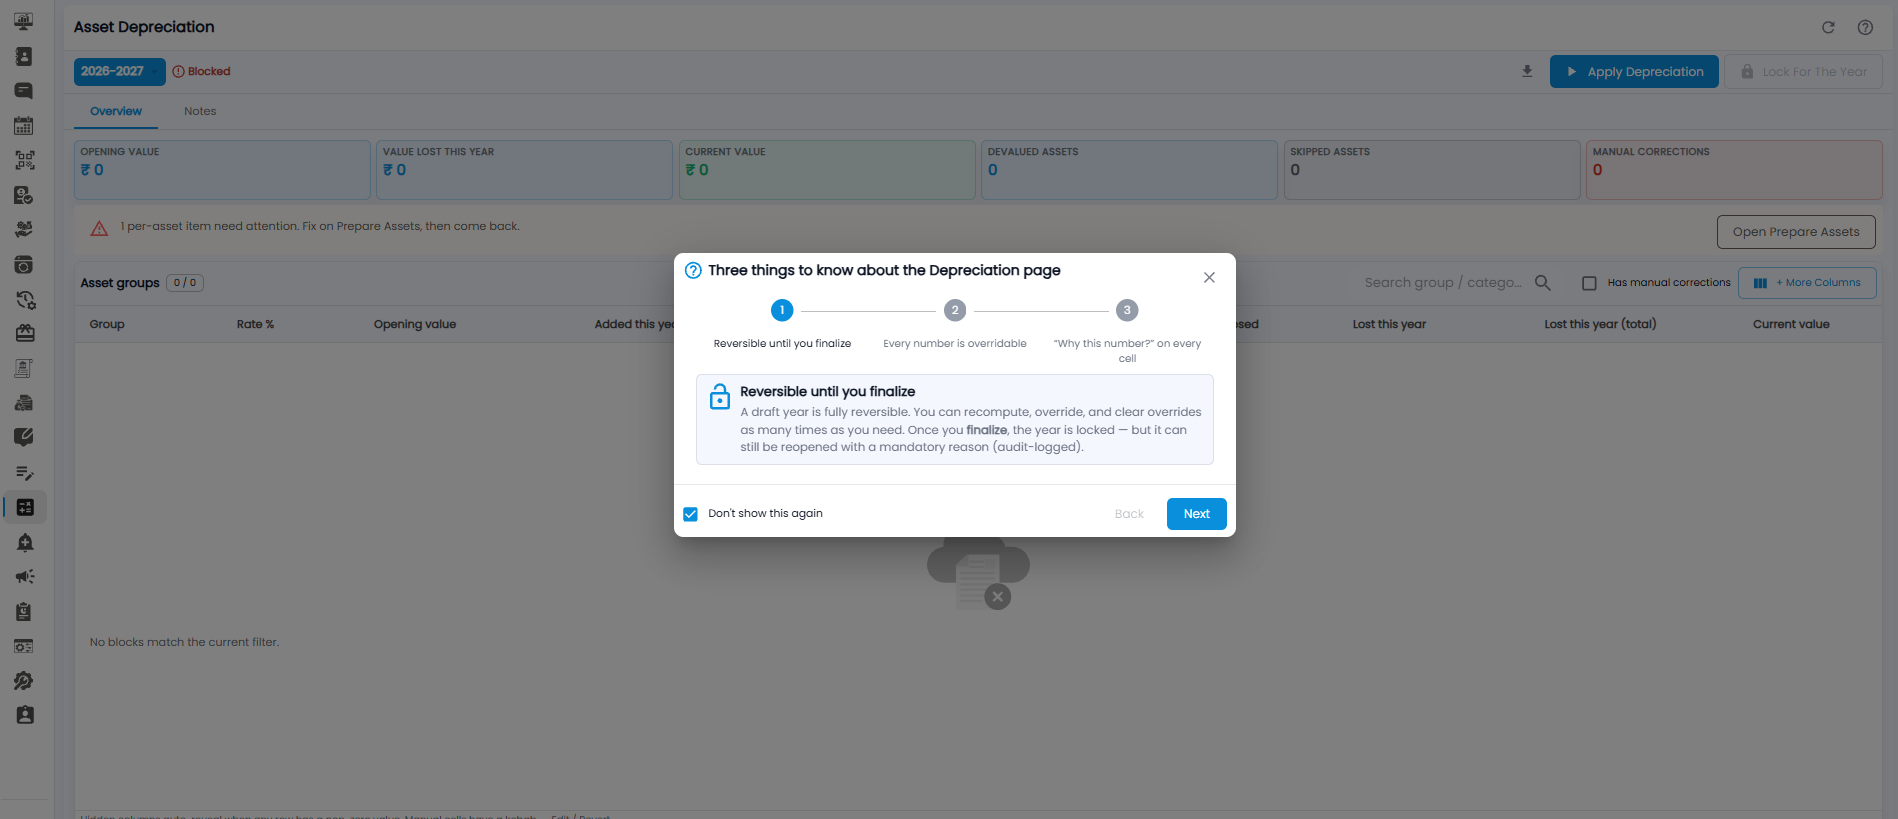
- Reversible until you finalize — a draft year is fully reversible. You can recompute, override, and clear overrides as many times as you need. Once you finalize, the year is locked, but it can still be reopened with a mandatory reason, which is recorded in the audit log.
- Every number is overridable — you can correct any calculated figure by hand.
- "Why this number?" on every cell — each figure can show how it was worked out.
The Asset Depreciation Page
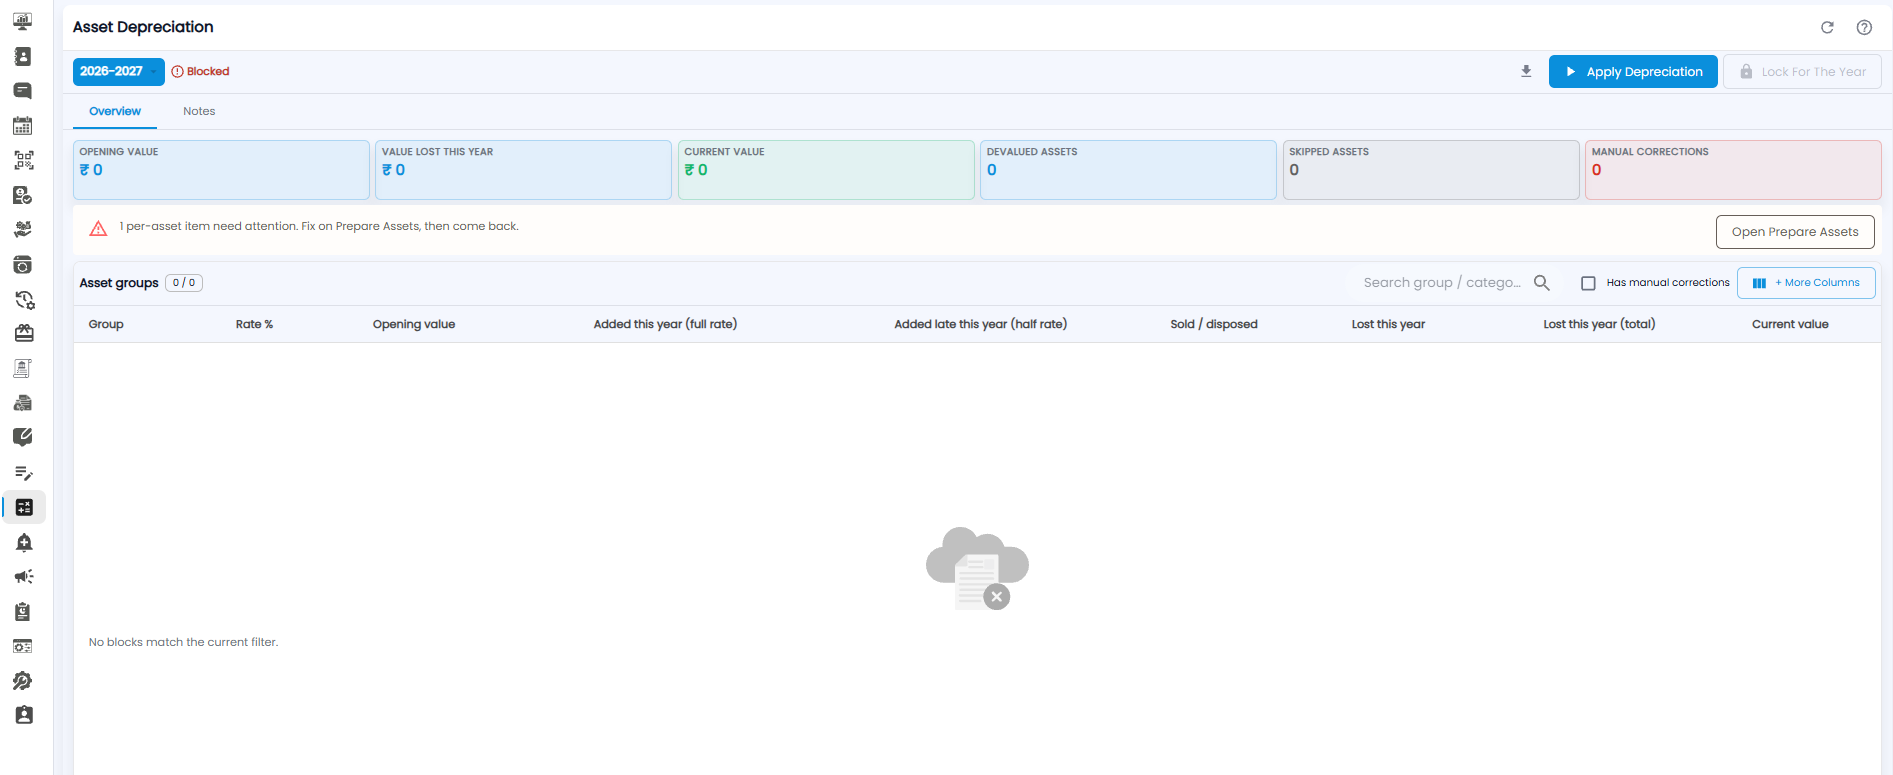
Financial Year and Actions
- Financial year — the blue button at the top left (for example 2026–2027) shows the year you are working on. The badge next to it shows the year's state, for example Blocked when something needs fixing before depreciation can be applied.
- Download icon — downloads the depreciation figures.
- Apply Depreciation — calculates depreciation for the year.
- Lock For The Year — finalizes the year. It stays greyed out until the year is ready to lock.
- Refresh and ? icons at the top right — reload the page and open help.
The page has two tabs: Overview (the figures) and Notes.
Summary Cards
| Card | What it shows |
|---|---|
| Opening Value | The value of your assets at the start of the year (₹) |
| Value Lost This Year | The depreciation for the year (₹) |
| Current Value | The value after this year's depreciation (₹) |
| Devalued Assets | How many assets were depreciated |
| Skipped Assets | Assets left out — for example land, or assets with Skip depreciation for this asset ticked when they were created |
| Manual Corrections | How many figures were overridden by hand |
Items That Need Attention
If some assets cannot be calculated yet, a message appears above the table — for example "1 per-asset item need attention. Fix on Prepare Assets, then come back." Click Open Prepare Assets, fix the items, and return to this page.
Asset Groups Table
Depreciation is shown per asset group. The count next to Asset groups shows how many groups are listed.
| Column | What it shows |
|---|---|
| Group | The depreciation group |
| Rate % | The depreciation rate for the group |
| Opening value | The group's value at the start of the year |
| Added this year (full rate) | Assets added this year that are depreciated at the full rate |
| Added late this year (half rate) | Assets added late in the year that are depreciated at half the rate |
| Sold / disposed | The value of assets sold or disposed of during the year |
| Lost this year / Lost this year (total) | The group's depreciation for the year |
| Current value | The group's value after depreciation |
- Use Search group / category to find a group.
- Tick Has manual corrections to show only groups with figures changed by hand.
- Click + More Columns to show extra columns. Hidden columns also appear on their own when any row has a non-zero value in them.
Doing Year-End Depreciation
- Choose the financial year
- If a message says items need attention, click Open Prepare Assets and fix them
- Click Apply Depreciation
- Review the summary cards and the Asset groups table. Correct any figure if needed
- Click Lock For The Year to finalize