
Overview
Reports & Trends shows how your depreciation and asset values change over the years, once depreciation has been applied. Open it from the sidebar: Depreciation > Reports & Trends.
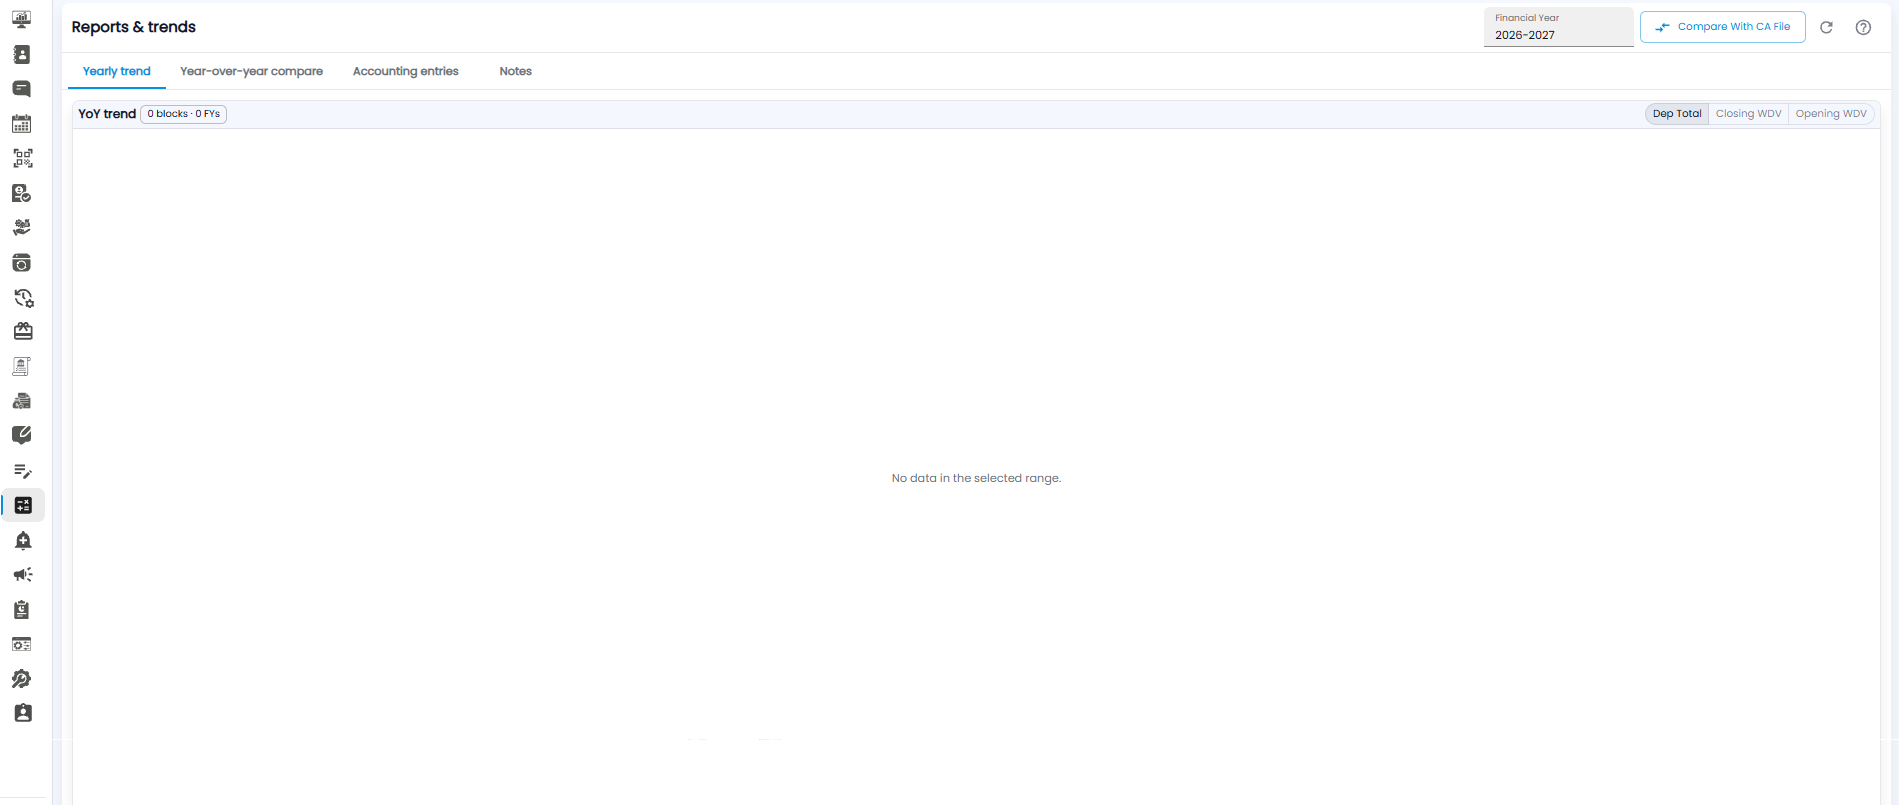
Year and Actions
- Financial Year — pick the year to report on.
- Compare With CA File — compare Tazk's figures with the depreciation file from your chartered accountant (CA).
- Refresh and ? icons — reload the page and open help.
Tabs
| Tab | What it shows |
|---|---|
| Yearly trend | A trend of depreciation over the years (shown below) |
| Year-over-year compare | One year's figures side by side with another's |
| Accounting entries | The entries to record the year's depreciation in your books |
| Notes | Notes about the year's depreciation |
Yearly Trend
The YoY trend chart shows how the figures change from year to year. The badge beside it shows how many groups and financial years are included, for example 0 blocks · 0 FYs. Use the buttons at the top right of the chart to switch what it shows:
- Dep Total — the total depreciation each year
- Closing WDV — the written-down value (the value after depreciation) at the end of each year
- Opening WDV — the written-down value at the start of each year
If no depreciation has been applied yet for the years selected, the chart shows No data in the selected range.
Tip: Apply depreciation in Year-End Depreciation first — the trend fills in once at least one year has figures.