
What does the Sales Forecast show in Tazk CRM?
Deals › Sales Forecast shows the expected revenue from your open deals. Four tiles give the open pipeline, the weighted forecast adjusted for each deal's chance of winning, and the deals won and lost. Two tables break the open deals down by pipeline stage and by forecast category. Choose a pipeline at the top right, or leave it on All pipelines.
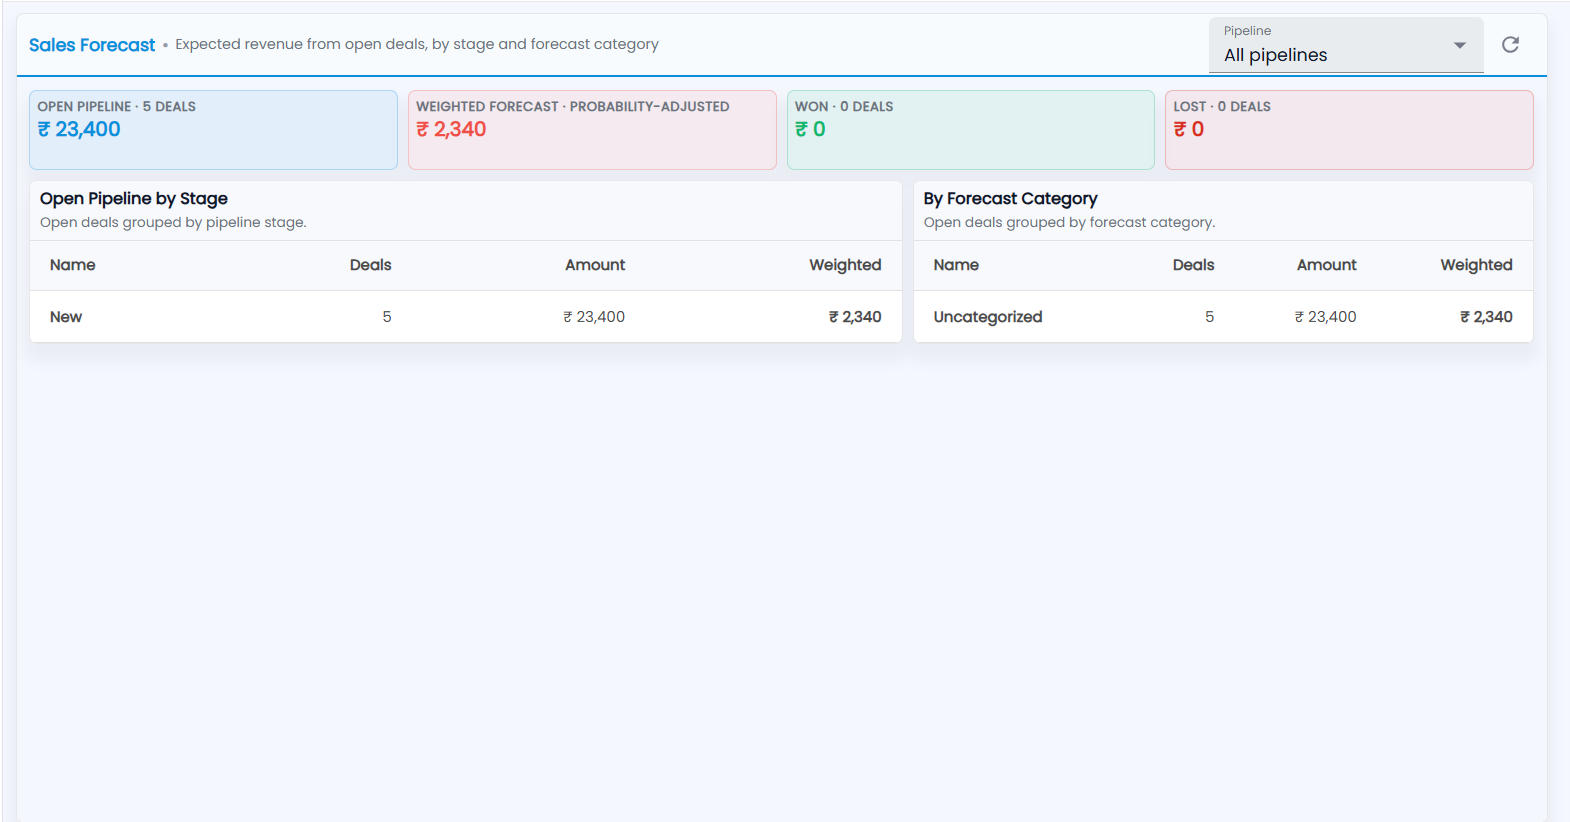
What do the four tiles show?
| Tile | What it shows |
|---|---|
| Open pipeline | How many deals are open, and their total amount |
| Weighted forecast | The open amount adjusted for each deal's probability — what you can realistically expect |
| Won | How many deals were won, and their total |
| Lost | How many deals were lost, and their total |
In the picture, 5 open deals worth ₹ 23,400 at 10% probability give a weighted forecast of ₹ 2,340.
What do the two tables show?
- Open Pipeline by Stage — open deals grouped by pipeline stage.
- By Forecast Category — deals grouped by forecast category. Deals without a saved category show as Uncategorized.
Both tables show, for each row, the Name, the number of Deals, their Amount and the Weighted value.
How do I see one pipeline?
Choose it in Pipeline at the top right — All pipelines shows every pipeline together. Click refresh to reload the figures.